Understanding Accuracy in Laser Scanners
One of the most consistent issues that I am asked to opine on early in a project is that of the accuracy of one particular scanhead versus another. Those of us in the industry have known for years that the manufacturers have done an excellent job of stating the accuracy of their instruments in ways that eliminate the average consumers’ ability to perform a direct comparison. After making a concerted effort to understand the issue and somehow correlate it with my own experiences using various makes and models I have come to the conclusion that the manufacturers are not necessarily being purposefully obtuse. There are some real, academic disagreements with how best to quantify and state the accuracy of a given instrument (although I still think the marketing department has editorial control of the tech sheets!) In case it was not obvious, I am not an Engineer (although I teach many how to scan), or a physicist (although I have seen every episode of the Big Bang Theory), however, neither are a lot of my clients. So, my intention here is to try and explain the variables and come to some conclusions in a way that can be understood by those of us that do not enjoy advanced statistics (my apologies to those who do).
When it comes to a laser scanner there are three basic types of errors that can lead to inaccuracies.
- Laser Range Error
- Comprised of two types: Range Error & Linearity Error
- Range Noise
- Mechanical Error
- Comprised of two types: Horizontal Error & Vertical Error
Let’s take a closer look so that we can better understand each of these three types of error.
Laser Range Error: No system is perfect and that includes laser scanners. When scanners are produced they are tested in measuring a target of known reflectivity at various known distances. This is repeated with targets of differing reflectivity producing a range of range values. The error in capturing the correct distance or range from the scanner to those targets is the range error. Comparing this error over multiple measurements (say 5000-15000 measurements) an error function is created and stored in the scanhead. This function is the Range Calibration. The Range Calibration is different for every individual scanner and it may change over time. This error is one that is recomputed when you send a scanner in to be calibrated. A second test (same procedure as before) is performed after the Range Calibration has been completed. The resulting error found in this test is referred to as Linearity Error. The Linearity Error is plotted on a curve centered on zero. A measurement of the offset of that plotted curve from zero is the stated Linearity Error. Think of it as “as good as it can get on a perfectly calculated scanhead”.
Range Noise: Have you ever looked at a point cloud of a flat wall and noticed that as you zoom in on a profile view that the point cloud is not a smooth flat surface but a noisy grouping of points? That is Range Noise. Technically it is the difference between each individual measurement and the mean distance to an object. There are several things that impact Range Noise. First is the distance to the object being scanned, second is the albedo or reflective quality of the object. However, scanning rates also have a large impact on range noise. Essentially the higher the scan rate the greater the Range Noise. This is where one of those academic issues comes into play. Some prefer a statement of Range Noise as an absolute (people with slower scan rates) while other insist that the Range Noise should be normalized (divide the range noise by the square root of the scan rate). If you are comparing two different instruments it’s important to know which way the Range Noise was calculated.
Mechanical Error: When considering most modern laser scanners they accomplish scanning in a 360° x 2×0° field of view by deflecting the laser via a rotating mirror in the vertical axis and spinning the scanhead around on a horizontal axis. These mechanical devices (mirror & servos) are also subject to error. While these mechanical devices are aiming the laser beam for us the scanner is calculating and recording the angle and bearing of the mirror and the scanhead each time the instruments sends out a laser pulse. In reality there is a difference between the measured angle and the actual angle in both the horizontal and vertical angles. This is referred to as the Angular Error. As this error is in the bearing used to calculate the XYZ position of each point in the point cloud the error increases as the range increases. For this reason it is typically stated as a Radiant value. This allows you to understand how the angular error increases at range. 1 mrad angle means 1mm spacing per meter in distance from the scanhead. For example the Z+F 5010/HDS7000 has an Angular Error of 0.122 mrad. This means that the error is 1.2mm at 10m, 6mm at 50m, and 12mm at 100m. This mechanical error is also recomputed when you send a scanner in to be calibrated. This is done by scanning a known 3D environment. This allows for the calculation of a mean angular error which is used as a correction against angular errors. The point to take from this section is that angular errors have little impact on measurements at close range but they can have a big impact on data scanned at long range.
The root of the problem is that these three types along with the physical properties of lasers make for some rather complicated outcomes while most customers want a simple (single) number as an answer. Sadly I can’t give it to you. I think that we need to keep seeing all of those confusing figures using whatever each manufacturer considers the gold standard in error calculation to be. The fact is, the level of error is very different if even one variable (range, angle to object, reflective quality of object, etc.) is altered. Many don’t think about the fact that this means there is a variance of accuracy even within one scanworld. But that doesn’t mean that we can’t help add to the overall understanding of the situation.
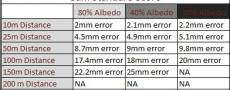
So, here is my proposal. Why don’t we develop a standard sample grid. An easy chart that like the EPA Mileage Certificate or the Nutritional Pyramid gives us an accurate snapshot of the performance of the instrument? I’m thinking a grid with various distances along one axis and various surfaces along the other showing the actual mean error of the instruments measurement compared to the known measurement. I know it’s not perfect; neither is the EPA’s Mileage Certificate. They calculate highway mileage driving in controlled conditions without considering a lot of real world applications. In other words, I will never get the exact numbers that they post on the sticker, but at least I can see that my Toyota Sequoia will take a lot more gas than my wife’s car. And that is what most customers are looking for; a direct comparison.